BBT Chart Guide: How to Track Basal Body Temperature for Fertility


Quick Answer: Basal body temperature (BBT) charting tracks your resting temperature to confirm ovulation. After ovulation, progesterone raises your temperature by 0.2-0.5°C, creating a clear shift on your chart. While BBT can't predict ovulation (only confirm it happened), it's a free, reliable method for understanding your cycle patterns.
Key Takeaways
- BBT charting confirms ovulation by tracking the temperature shift caused by progesterone after the egg is released.
- Temperatures before ovulation (follicular phase) are lower; after ovulation (luteal phase), they rise by 0.2-0.5°C and stay elevated until your period.
- Take your temperature at the same time every morning, before getting out of bed, using a basal thermometer that reads to 0.01°C.
- BBT cannot predict ovulation - it only confirms it happened 1-2 days after the fact. Combine with OPKs or cervical mucus for predictive timing.
- Look for the overall pattern over 3+ cycles rather than obsessing over individual daily temperatures.
What Is Basal Body Temperature (BBT)?
Basal body temperature charting is one of those old-school fertility methods that actually still works really well - if you know how to do it properly. I've been helping women chart their BBT for years, and I love it because it gives you real, concrete data about your own body. No apps guessing. Just you and your thermometer.
BBT charting is one of the oldest methods of fertility tracking, dating back to the 1930s when it was first studied by Vollman (1977) and others. Despite being "low-tech," it remains one of the most reliable methods for confirming ovulation - and it's completely free (once you've bought a thermometer).
How Does BBT Work for Fertility?
The Hormonal Mechanism
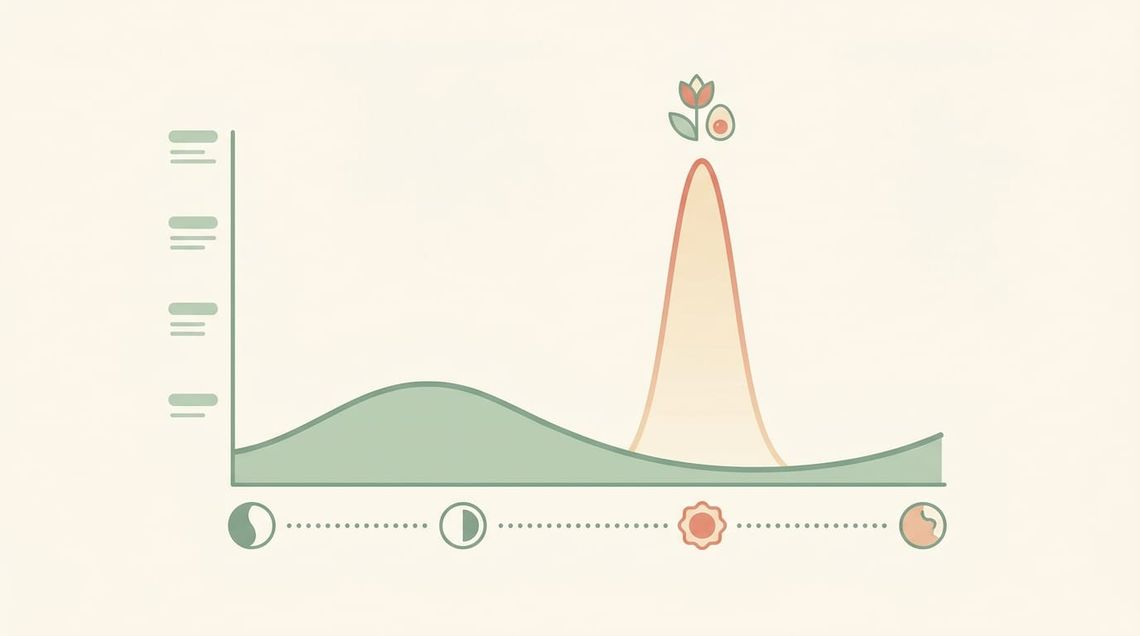
During the follicular phase (before ovulation), your body temperature is relatively low - influenced by oestrogen. When you ovulate, the ruptured follicle transforms into the corpus luteum, which produces progesterone. Progesterone acts on your body's temperature-regulating centre (the hypothalamus) and raises your core body temperature by approximately 0.2-0.5°C (0.4-1.0°F).
This temperature shift typically occurs 1-2 days after ovulation and remains elevated throughout the luteal phase (approximately 12-16 days). If pregnancy occurs, the temperature stays elevated. If it doesn't, progesterone drops, your temperature falls, and your period arrives.
This pattern - low temperatures before ovulation, sustained high temperatures after - is the foundation of BBT charting.
What BBT Can and Cannot Tell You
BBT can:
- Confirm that ovulation occurred
- Show the approximate day of ovulation (within 1-2 days)
- Indicate the length of your luteal phase
- Provide early clues about pregnancy (sustained elevated temperatures beyond your normal luteal phase)
- Reveal cycle irregularities over time
BBT cannot:
- Predict ovulation before it happens - you'll see the shift after the fact
- Tell you your most fertile days in advance (the shift happens 1-2 days post-ovulation, by which time the peak fertile window has passed)
- Diagnose fertility problems on its own
This is why I always recommend combining BBT with a predictive method like OPKs or cervical mucus tracking. BBT tells you what happened; OPKs tell you what's about to happen.
How to Take Your BBT
Getting accurate BBT readings requires consistency. Here's the protocol I'd recommend:
Equipment
- Basal thermometer: Regular thermometers read to 0.1°C, which isn't precise enough. You need a basal thermometer that reads to 0.01°C (or 0.02°F). Digital basal thermometers are convenient and quick; glass thermometers are slightly more accurate but take longer.
- Charting method: Paper charts, fertility apps (Fertility Friend, Read Your Body, Kindara), or a spreadsheet.
The Protocol
- Take your temperature at the same time every morning (within 30 minutes if possible). Set an alarm if necessary.
- Before you do anything else - before sitting up, talking, drinking water, or checking your phone. Even small movements can raise your temperature and give a false reading.
- Use the same method every day - either oral (under the tongue), vaginal, or rectal. Vaginal and rectal are slightly more consistent, but oral is the most common and perfectly adequate for most women.
- Hold the thermometer in place for the full time recommended (usually 3-5 minutes for glass, 1-2 minutes for digital - until it beeps).
- Record your temperature immediately - don't try to remember it later.
- Make a note of any disturbances - illness, alcohol, poor sleep, stress, travelling, or taking your temperature at a different time. These can all affect readings and should be noted on your chart.
Oral vs. Vaginal vs. Rectal
All three methods work. The key is consistency - use the same method every day.
- Oral: Most common and convenient. Can be affected by mouth breathing, talking, or drinking. Place the thermometer under your tongue, toward the back.
- Vaginal: Slightly more consistent than oral, as it's less affected by ambient temperature or breathing. Some women find it more reliable.
- Rectal: Considered the most accurate but less commonly used for practical reasons.
How to Read a BBT Chart
This is where many women get overwhelmed - I see this all the time, so let me break down what you're looking for.
The Biphasic Pattern
A normal, ovulatory BBT chart shows two distinct temperature phases - hence "biphasic":
- Follicular phase (pre-ovulation): Lower temperatures, typically ranging from about 36.1-36.4°C (97.0-97.5°F). There may be some variation, but the overall trend is consistently low.
- Ovulation: A brief dip sometimes occurs on the day of ovulation itself (not always present - don't rely on it).
- Luteal phase (post-ovulation): Temperatures jump up and stay elevated, typically reaching 36.4-37.0°C (97.5-98.6°F). The shift from low to high is usually clear - a rise of at least 0.2°C above the previous 6 temperatures.
- Pre-menstrual: Temperatures drop back down 1-2 days before your period starts (as progesterone falls).
Identifying Ovulation on Your Chart
According to the Fertility Awareness Method (FAM) rules established by Trussell (2004), ovulation is confirmed when you see:
- At least 3 consecutive temperatures that are higher than the previous 6 temperatures
- The shift should be at least 0.2°C (0.2°F) above the highest of the previous 6 low temperatures
- The higher temperatures should remain elevated for at least the length of your typical luteal phase
What Different BBT Patterns Mean
Normal Biphasic Chart
Clear low phase followed by a distinct shift to sustained high temperatures. This confirms ovulation occurred. Most reassuring pattern.
Slow Temperature Rise
The shift from low to high is gradual over 3-5 days rather than a sharp jump. This can indicate a weaker ovulation or a slower corpus luteum maturation. Keulers et al. (2007) found that slow temperature rises were associated with slightly lower fertility potential in that cycle, though many women with slow rises do conceive.
No Clear Shift (Monophasic)
Temperatures remain relatively flat throughout the cycle with no sustained rise. This typically indicates anovulation - no egg was released. I always reassure my clients that one anovulatory cycle occasionally is completely normal; consistently anovulatory charts are something I always flag for further investigation.
Short Luteal Phase
Temperatures shift up but drop back down within 10 days or less (instead of the normal 12-16 days). A luteal phase shorter than 10 days may indicate luteal phase deficiency, which can affect implantation. Strott et al. (1970) described luteal phase deficiency as a factor in early pregnancy loss.
Sawtooth Pattern
Temperatures fluctuate erratically with no clear biphasic trend. In my experience, this can be caused by inconsistent timing, illness, sleep disturbances, or - if persistent - hormonal irregularities.
BBT Chart for Pregnancy
One of the most exciting things about BBT charting is that it can provide an early hint of pregnancy - though I want to temper expectations because it's not definitive.
Signs of Pregnancy on a BBT Chart
- Sustained high temperatures beyond your normal luteal phase: If your temperatures typically drop 14 days after ovulation but remain elevated on day 16, 17, 18 - this is a promising sign. The corpus luteum continues producing progesterone to maintain the pregnancy.
- Implantation dip: Some charts show a brief temperature dip around days 7-10 post-ovulation, which may correspond to implantation. However, this also occurs in non-pregnant cycles, so it's not reliable on its own.
- Triphasic chart:
A third temperature level (higher than the luteal phase plateau) around days 7-10 post-ovulation can suggest pregnancy. Barton et al. (2000) found that triphasic patterns were more common in conception cycles, though they also occurred in non-conception cycles.
Remember: BBT is suggestive, not diagnostic. If your temperatures remain elevated beyond your normal luteal length, take a pregnancy test.
BBT Chart for Miscarriage
BBT can also provide early indicators of potential pregnancy loss, though it's a sensitive topic that I want to handle carefully:
- Temperatures dropping during the luteal phase when you have a positive pregnancy test may indicate a threatened miscarriage or ectopic pregnancy
- A temperature pattern that doesn't sustain the elevated luteal phase in a suspected pregnancy cycle is a concerning sign
I want to stress: BBT should not be used as the sole indicator of pregnancy health. I always encourage following up with your doctor and clinical testing (blood hCG, ultrasound) if you have concerns.
Common BBT Charting Mistakes
After reading about common pitfalls, here's what to avoid:
- Inconsistent timing: Taking your temperature at different times each morning is the #1 source of chart noise. Even 30 minutes' difference can change your reading by 0.1°C.
- Getting up before temping: Even sitting up in bed raises your temperature. Thermometer first, everything else second.
- Using a non-basal thermometer: Standard fever thermometers aren't precise enough to detect the subtle 0.2°C shift that confirms ovulation.
- Over-interpreting individual temps: One high or low temperature doesn't mean anything. Look at the overall pattern across the cycle.
- Ignoring disturbances: If you had a terrible night's sleep, drank alcohol, or woke up an hour early, mark it on your chart. These factors can cause false readings.
- Giving up after one cycle: BBT charting is most useful when you have 3+ months of data. Patterns become clearer, and you learn your individual normal.

BBT and Fertility Awareness Methods (FAM)
BBT charting is a core component of Fertility Awareness Methods (FAM), which are evidence-based approaches to both achieving and avoiding pregnancy. Frank-Herrmann et al. (2007) conducted a large European study and found that symptothermal FAM (combining BBT, cervical mucus, and cervical position) had a method effectiveness of 99.6% for avoiding pregnancy when used correctly.
For trying to conceive, the Symptothermal Method combines:
- BBT - to confirm ovulation
- Cervical mucus - to identify the approaching fertile window
- Cervical position - optional additional sign
- OPKs - for additional LH surge data (modern addition)
This multi-method approach provides both prediction (cervical mucus and OPKs for the fertile window) and confirmation (BBT for ovulation), giving you the complete picture.
Dani Recommends
After researching BBT charting extensively, here's my practical advice:
Start with Fertility Friend - it's the gold standard for BBT charting apps. The free version is excellent (the premium adds analysis features). It automatically draws your coverline, identifies your shift, and can overlay your OPK results.
Invest in a good basal thermometer. The Mabis or iProven digital basal thermometers are under $15/£12 and do the job well. The Tempdrop wearable is a worthwhile upgrade if you find manual temping too disruptive.
Give yourself 3 full cycles before drawing conclusions. Your first chart will probably look messy - that's normal. By cycle 3, you'll see your patterns clearly.
Combine BBT with OPKs for the most complete picture. OPKs tell you when to have sex; BBT confirms your timing was right.
Frequently Asked Questions
What should my BBT chart look like?
A normal ovulatory chart shows a clear biphasic pattern: lower temperatures during the follicular phase (typically 36.1-36.4°C), a shift to higher temperatures after ovulation (36.4-37.0°C), and a drop back to baseline before your period. The shift should be at least 0.2°C above the previous 6 temperatures.
Can I get pregnant from BBT charting alone?
BBT confirms ovulation after it's happened, which means by the time you see the temperature shift, your most fertile days have already passed. For trying to conceive, BBT alone is insufficient - combine it with OPKs or cervical mucus tracking to identify the fertile window in advance.
What if my BBT doesn't show a clear shift?
An unclear shift can have several causes: inconsistent timing, too few days of charting, illness, or anovulation. Try charting for at least 3 full cycles with careful timing before concluding there's a problem. If you consistently see no shift, bring your charts to your doctor - this is exactly what I tell my clients to do - they can order a day-21 progesterone blood test to confirm whether ovulation occurred.
Does BBT rise if I'm pregnant?
If you're pregnant, your BBT will typically remain elevated beyond your normal luteal phase length (usually 12-16 days). Temperatures that stay high for 18+ days after ovulation are a strong indicator of pregnancy. However, BBT is not a reliable pregnancy test - take a home pregnancy test if your period is late.
What causes BBT fluctuations?
Many factors can cause BBT fluctuations: inconsistent timing, poor sleep, alcohol, illness or infection, stress, travelling across time zones, sleeping with a heating blanket, mouth breathing, and thyroid conditions. Note any disturbances on your chart and look at the overall trend rather than individual data points.
Can BBT charting work with irregular cycles?
Yes. BBT charting actually becomes more valuable with irregular cycles because it confirms whether ovulation occurred each cycle, regardless of cycle length. A 35-day cycle with a clear temperature shift is ovulatory; a 28-day cycle without one is not. The chart gives you information that calendar-based methods can't.
How long should I chart before seeing a doctor?
In my experience, if you've been charting for 3+ cycles and consistently see anovulatory patterns (no temperature shift), short luteal phases (<10 days), or other irregularities, it's worth bringing your charts to your doctor. The charts provide valuable data that supplements clinical testing.
Cite This Page
Bowen, D. (2026). BBT Chart Guide: How to Track Basal Body Temperature for Fertility. Fertilitys. Retrieved from https://fertilitys.com/bbt-chart-guide
References
- Barton, M., et al. (2000). Triphasic basal body temperature in pregnancy. Fertility and Sterility, 74(3), S205.
- Frank-Herrmann, P., et al. (2007). The effectiveness of a fertility awareness-based method to avoid pregnancy in relation to a couple's sexual behaviour during the fertile time. Human Reproduction, 22(5), 1310-1319.
- Keulers, M.J., et al. (2007). The effect of the speed of the rise of the basal body temperature on the fertility window. Fertility and Sterility, 88(Suppl 1), S236.
- Strott, C.A., et al. (1970). The short luteal phase. Journal of Clinical Endocrinology and Metabolism, 30(2), 246-251.
- Trussell, J. (2004). Contraceptive failure in the United States. Contraception, 70(2), 89-96.
- Vollman, R.F. (1977). The menstrual cycle. Major Problems in Obstetrics and Gynecology, 7, 1-193.
Medical Disclaimer: This article is for informational purposes only and does not constitute medical advice. If you have concerns about your menstrual cycle or fertility, please consult a qualified healthcare professional for personalised guidance.
Written by

Subscribe to Fertilitys
All my Free Resources. No spam. Unsubscribe anytime.